Why Your Electric Bill Keeps Climbing in 2026 — and How Much of It Is AI
Residential electricity prices are set to average 18.2 cents per kWh in 2026, and data centers are part of the story. Here's what's really driving your bill, what's AI, what isn't, and how to estimate your own increase.
Sujit Karki
|||4 min read
#electricity bills#AI data centers#household budget#energy costs#inflation
Frequently Asked Questions
The EIA forecasts residential electricity prices to average 18.2 cents per kWh in 2026, a nearly 5% increase from 2025, with growth of roughly 5%–7% a year in East Coast regions through 2027.
Get new posts in your inbox
No spam, unsubscribe anytime.
About the Author
Sujit KarkiFinance Researcher & Market Analyst
Independent finance researcher and market analyst with expertise in macroeconomics, equity markets, and personal finance. I help regular investors make better-informed decisions through rigorous, data-driven analysis.
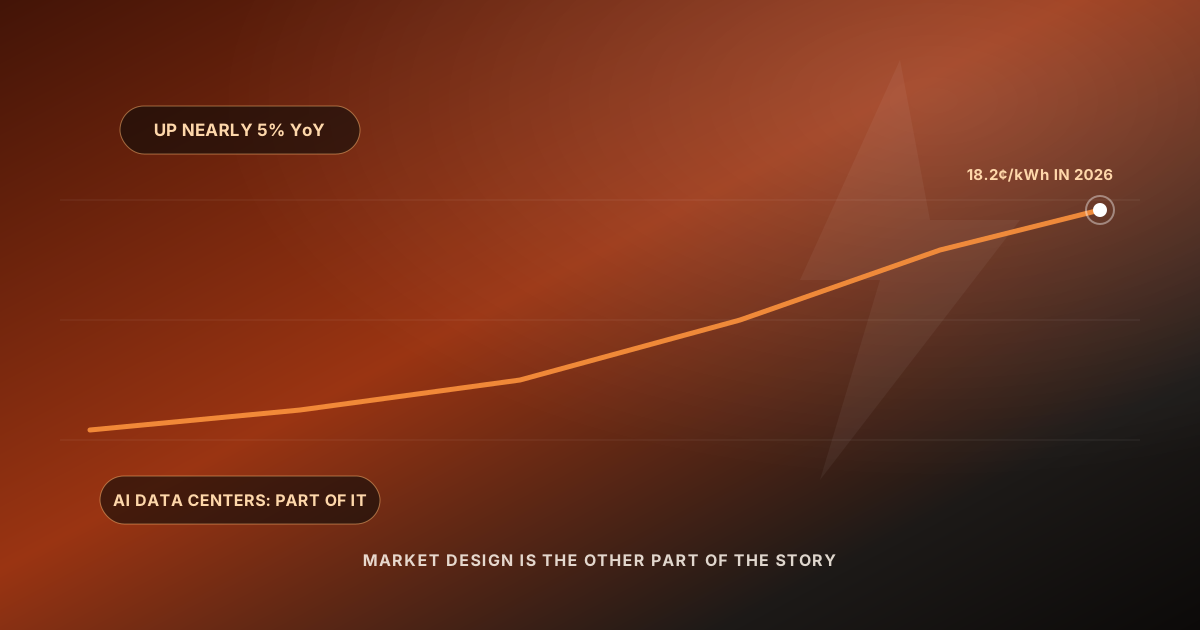
Here's the number to anchor on: the U.S. Energy Information Administration expects residential electricity to average 18.2 cents per kilowatt-hour in 2026, a nearly 5% increase over 2025 — and while AI data centers are a real part of the story, they are not the whole story, and the difference matters for what you can actually do about your bill.
I've watched the "AI is spiking your power bill" narrative harden into political fact this year, and the truth is more mixed and more useful than the headline.
Key Takeaways
Residential electricity is forecast to average 18.2 cents/kWh in 2026, up nearly 5% year over year (EIA).
East Coast regions (Mid-Atlantic, East North Central, South Atlantic) face the steepest hikes: roughly 5%–7% a year through 2027.
Commercial electricity demand — which includes data centers — is projected to exceed residential use for the first time on record in 2027.
Retail electricity prices have outpaced inflation since 2022.
How much is 'AI' versus market design is genuinely contested — don't accept a single headline.
The national number
Per the EIA's May 2026 Short-Term Energy Outlook, "the price of electricity paid by U.S. residential customers averages 18.2 cents per kilowatthour in 2026... a nearly 5% increase from 2025," with residential prices expected to grow at "a slightly lower rate of 2% next year." The commercial sector — the category that captures data centers — is growing much faster, and the EIA forecasts commercial electricity consumption will surpass residential use for the first time on record in 2027.
How much of this is actually AI?
This is where I want to be careful, because two credible analyses measure different things and reach different emphases. Data centers are undeniably adding load — the Electric Power Research Institute estimated they could account for 4.6% to 9.1% of U.S. electricity consumption by 2030, up from about 4% in 2023. And per Bloomberg's September 30, 2025 analysis of roughly 25,000 grid nodes across seven regional grids, wholesale prices at some nodes near data centers rose 267% between April 2020 and April 2025.
But the semiconductor research firm SemiAnalysis argued that in the PJM grid region — serving 67 million people across 13 states — most of a roughly 15% household bill increase traces to an obscure capacity-auction mechanism (the Base Residual Auction) and market design, not purely AI demand. The PJM capacity auction jumped 9.3x over the prior year in one cycle.
Note
Both things are true: data centers are adding real demand to a grid that saw two decades of flat growth, AND specific market-design choices are amplifying the price signal beyond what raw demand alone would produce. If someone tells you it's "all AI" or "not AI at all," they're selling you something.
The policy response is live. The White House signed a pact with several states calling for tech companies to pay for new power plants in the PJM grid, and there's bipartisan pressure to make data centers — not households — pay for the grid upgrades they require.
Why your region matters more than the average
The national average hides enormous variation. As of April 2026, Hawaii's residential rate was about 46.62 cents/kWh while North Dakota's was about 12.35 cents — a nearly 4x spread — against a national residential average near 18.83 cents. If you live in the Mid-Atlantic near "Data Center Alley," your trajectory looks nothing like someone in the wind-powered Plains.
Enter your monthly kWh usage and current rate; the tool projects your annual cost and what a 5% (or your chosen) rate increase does to it over time.
Interactive · project your own bill
What rising rates do to your annual electric bill
Monthly usage900 kWh
Current rate18.2¢/kWh
Assumed annual rate increase5%
Years to project3 years
This year
$0
Year 3
$0
Cumulative increase
$0
Projected annual electric bill by year
Year
Rate (¢/kWh)
Annual bill
1
18.2
$1,966
2
19.1
$2,064
3
20.1
$2,167
Estimate only; actual rates vary by utility, rate plan, and usage. Applies a constant annual increase compounded each year — real rate changes come in uneven steps set by state regulators.
Here's What I'd Actually Do
Find your actual rate and usage on your latest bill (cents/kWh and monthly kWh). You can't manage what you haven't measured.
Check whether your state has retail choice. In deregulated markets you may be able to lock a fixed supply rate and avoid the worst of capacity-driven spikes.
Attack usage, not just rate. The cheapest kilowatt-hour is the one you don't use — thermostat setpoints, heat-pump efficiency, and shifting heavy loads off peak move the needle.
Budget for the increase, don't be surprised by it. If you're on the East Coast, pencil in 5%–7% annual rate growth through 2027 rather than assuming flat.
Engage locally. Whether data centers pay for their own grid upgrades is being decided in state legislatures and utility commissions right now — that's where your bill is actually set.
Frequently Asked Questions
The EIA forecasts residential prices to average 18.2 cents/kWh in 2026, a nearly 5% increase from 2025, with 5%–7% annual growth in East Coast regions through 2027.

 Sujit Karki|||4 min read