Q2 GDP and the June Inflation Print Land the Same Morning. Here's What They Actually Tell You.
On July 30, 2026, the advance Q2 GDP estimate and the June PCE inflation report arrive together. Here's how to read a slowing-but-not-stalling economy alongside inflation that's still well above target — and what it means for your money.
The advance estimate for second-quarter 2026 GDP is scheduled for July 30, 2026, at 8:30 a.m. ET from the Bureau of Economic Analysis. The June Personal Income and Outlays report, which contains the PCE inflation gauge, is scheduled for the same morning.
Get new posts in your inbox
No spam, unsubscribe anytime.
About the Author
Sujit KarkiFinance Researcher & Market Analyst
Independent finance researcher and market analyst with expertise in macroeconomics, equity markets, and personal finance. I help regular investors make better-informed decisions through rigorous, data-driven analysis.
On the morning of July 30, 2026, two of the most important economic releases of the quarter land at the same time: the advance estimate of second-quarter GDP and the June PCE inflation report. My bottom line before either prints: the setup is a slowing-but-not-collapsing economy running alongside inflation that's still uncomfortably above target — the awkward combination that keeps the Fed on hold and keeps your borrowing costs high.
I'll be honest about what we know and what we don't, because these are scheduled releases whose results aren't out as I write. Everything below is the pre-release backdrop as of July 24, 2026 — check the actual July 30 releases at bea.gov before treating any figure here as current.
Key Takeaways
Advance Q2 2026 GDP and June PCE both release July 30, 2026, at 8:30 a.m. ET (BEA).
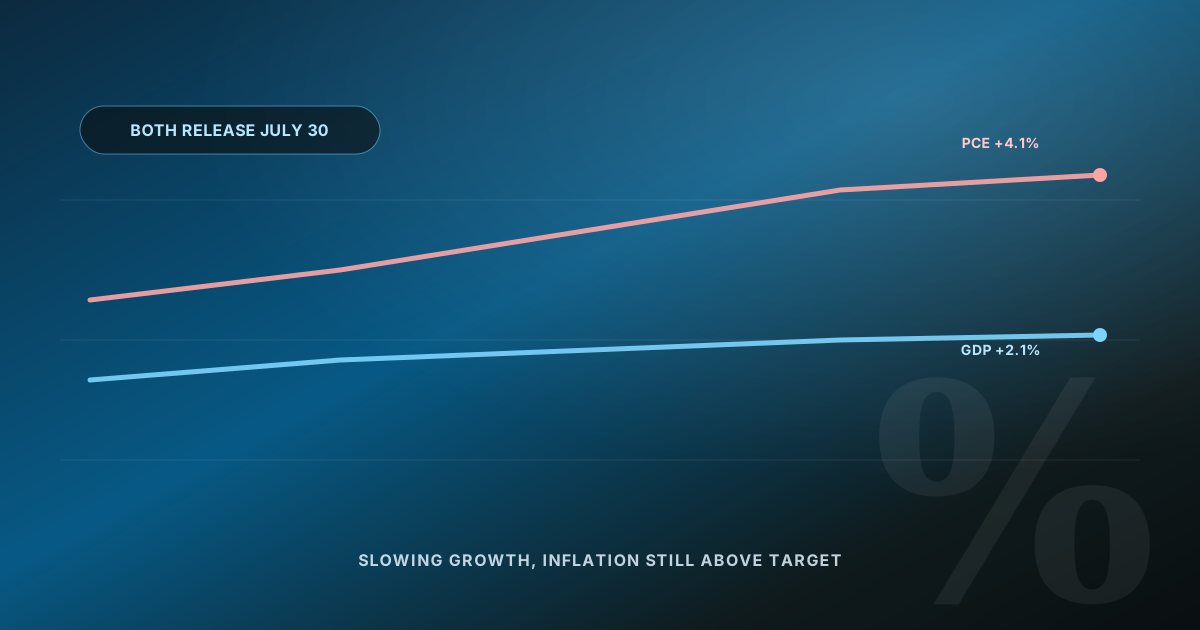
Q1 2026 real GDP grew 2.1% (third estimate), revised up from 1.6% mostly on lower imports.
May 2026 headline PCE ran 4.1% year over year — highest since April 2023; core PCE 3.4%.
The Fed, now chaired by Kevin Warsh, held rates at its June 17, 2026 meeting and has stressed 'no tolerance' for high inflation.
GDP and inflation measure different things — a decent growth number does not mean your cost of living is under control.
Two releases, one morning
The Bureau of Economic Analysis has the GDP advance estimate for Q2 2026 scheduled for July 30, 2026, at 8:30 a.m. ET. The June Personal Income and Outlays report — which carries the PCE price index, the Fed's preferred inflation gauge — is scheduled for the same day and time.
The growth picture going in
Real GDP grew at a 2.1% annual rate in the first quarter of 2026, per the BEA's third estimate released June 25, 2026. That was an upward revision from 1.6%, and here's the honest nuance: the revision was flattered by a large downward revision to imports (which are subtracted in the GDP formula), not by a surge in underlying demand. Consumer spending contributed just 0.4 percentage point in Q1.
Warning
Watch the composition, not just the headline. A GDP number propped up by falling imports or inventory swings is weaker than the same number driven by consumer spending and business investment. When the Q2 figure prints, read past the top line to what's actually growing.
Consumer spending — the engine of this expansion — was showing signs of fatigue going into Q2, with elevated energy costs eroding purchasing power after the spring oil shock. This is the same affordability squeeze I've traced through record home prices and 6.55% mortgage rates and rising electricity bills.
The inflation problem
Here's the tension. For May 2026, the headline PCE price index rose 4.1% year over year — the highest since April 2023 — and core PCE (excluding food and energy) rose 3.4%, the highest core reading since October 2023. Both are well above the Fed's 2% target.
This is where I have to flag a genuine measurement distinction that trips people up. PCE and CPI are both "inflation," but they use different baskets, weights, and methodologies, and they routinely disagree. The Fed targets PCE, so that's the number that drives rate policy — but the number you feel at the grocery store or gas pump may track CPI or neither. They are not interchangeable, and headlines that use them as synonyms will mislead you.
The May inflation surge was driven substantially by an energy shock — gasoline prices rose 6.5% in May after a 5.5% April increase — tied to the spring conflict. Crude eased in June after a U.S.–Iran memorandum of understanding to reopen the Strait of Hormuz, so May may have marked a peak. That's the key uncertainty in the June print. For the mechanics of how the Fed weighs this, see understanding Federal Reserve policy.
From release to your wallet
How one morning's data turns into your interest rate
1
GDP print lands
Measures growth — is the economy expanding or slowing?
2
PCE print lands, same morning
Measures inflation — the Fed's preferred gauge, not CPI
3
The Fed reads both together
Growth alone would argue for cuts; core PCE at 3.4% argues against them
4
Result: hold, higher-for-longer
The Fed has stressed "no tolerance" for inflation above target
5
What it means for you
Borrowing costs stay elevated; a raise below ~4% is a real pay cut
Illustrative chain of reasoning, not a forecast of what the Fed will actually do on any given date.
What the numbers mean for you
This tool translates the abstract GDP and PCE figures into a personal frame: how much a given inflation rate erodes your purchasing power and what raise you need just to break even.
Interactive · your raise vs. inflation
Is your paycheck actually keeping up?
Current annual income$60,000
Your raise3.0%
Inflation rate (PCE or CPI, your choice)4.1%
New nominal income
$0
New real (inflation-adjusted) income
$0
Real change in purchasing power
+0.0%
Break-even raise needed
4.1%
Illustration using a chosen inflation rate; your personal inflation rate differs from the national PCE/CPI figures based on your own spending mix. Not financial advice.
Here's What I'd Actually Do
Don't trade on the print. These numbers move markets for a few hours; they should not move a long-term plan. If you're tempted to react, that's the signal to do nothing.
Assume higher-for-longer. With core PCE at 3.4% and the Fed stressing price stability, don't budget for near-term rate cuts. Price your borrowing decisions off today's rates, not hoped-for ones.
Protect purchasing power. If your raise didn't beat ~3–4% inflation, your real income fell. Negotiate, and keep emergency cash in a high-yield vehicle rather than a zero-interest account.
Separate what you feel from what the Fed watches. Track both PCE and CPI, and know that your personal inflation rate depends on your own spending basket.
Revisit the release the morning it drops. The numbers in this post are the pre-release backdrop; the actual Q2 GDP and June PCE figures print July 30 and could change the read.
Frequently Asked Questions
The advance estimate is scheduled for July 30, 2026, at 8:30 a.m. ET from the BEA. The June PCE report is the same morning.

 Sujit Karki||4 min read