Gold Crashed From $5,600 to $4,000 — Safe Haven or Bubble Popping?
Gold fell nearly 29% from its January 2026 record. Here's why it's a rate-driven correction rather than a popped bubble, what history says about gold crashes, the 28% tax trap nobody mentions, and how much to actually hold.
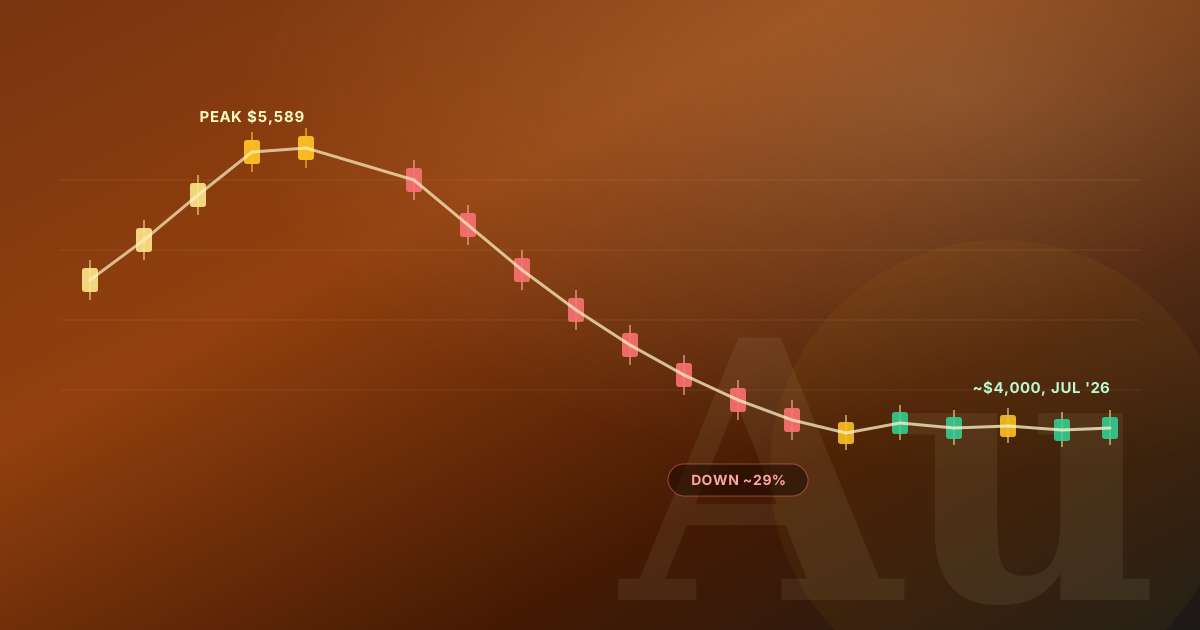
Gold didn't crash so much as correct hard after an extreme run. It hit a record near $5,589/oz on January 28, 2026, driven by the Iran war, central-bank buying, and de-dollarization fears. Since then, a hawkish Fed under Chair Kevin Warsh, rising real yields, a stronger dollar, and simple profit-taking after a huge rally have pulled it down to roughly $3,965–4,017/oz by mid-July — a correction of nearly 29%, but still well above where gold traded before this cycle's rally began.
Get new posts in your inbox
No spam, unsubscribe anytime.
About the Author
Sujit KarkiFinance Researcher & Market Analyst
Independent finance researcher and market analyst with expertise in macroeconomics, equity markets, and personal finance. I help regular investors make better-informed decisions through rigorous, data-driven analysis.
Gold hit a record ~$5,589/oz on January 28, 2026, then fell nearly 29% to roughly $3,965–4,017/oz by mid-July — driven by a hawkish Fed, rising real yields, and profit-taking, not a broken safe-haven thesis
Central-bank gold buying, the engine of the multi-year rally, slowed to ~863 tonnes in 2025 after three straight years above 1,000 tonnes (2022-2024) — a real deceleration, not a reversal
Historical gold crashes have been much deeper: -45% in 2011-2015 and roughly -85% peak-to-trough in the 1980s cycle before a decades-long nominal recovery
Physical gold and grantor-trust ETFs (GLD, IAU, SGOL) face a 28% collectibles tax rate on long-term gains — well above the usual 15-20% for stocks — while mining stocks like GDX get normal capital-gains treatment
Common allocation guidance runs 5-10% of a portfolio, with the World Gold Council citing ~5% as a Sharpe-ratio-improving level and Ray Dalio publicly favoring 10-15%
Gold went from the most exciting trade of early 2026 to the target of "I told you it was a bubble" takes in about six months. Both reactions are overcorrections.
Let's start with the number that matters: gold hit a record ~$5,589 an ounce on January 28, 2026. By mid-July, it was trading around $3,965 to $4,017 — a drop of nearly 29%. Silver, gold's louder cousin, fell from a peak near $59–60 to around $55.20. If you bought anywhere near the top, that's a real, painful loss. If you're looking at the chart from the outside wondering whether the "gold supercycle" story was always nonsense, I'd push back — the drivers behind the rally mostly haven't disappeared, they've just been temporarily overpowered by a hawkish Fed and a stronger dollar.
Peak (Jan 28, 2026)$0All-time record
Current (Jul 17, 2026)$0Roughly, mid-July
Drawdown0%Peak to current
Here's the full picture: why gold ran so hard, why it's cracking now, what history actually says about gold crashes, the tax detail almost nobody mentions before they buy, and how much of this stuff actually belongs in a normal portfolio.
The Fall, in Numbers
Nothing about this move is subtle. Gold ripped from roughly $2,600 in early 2025 to $5,589 by January 28, 2026 — more than doubling in about a year, one of the fastest moves in its trading history. Then it gave back nearly 29% of that gain in under six months. Both halves of that chart are extreme, and it's worth holding both truths at once: a parabolic run and a violent correction can both be legitimate market behavior, not proof of manipulation or fraud.
Why Gold Ripped to $5,600 in the First Place
Three forces stacked on top of each other through 2025 and early 2026:
Geopolitical risk. The Iran conflict, which began February 28, 2026 following earlier tensions, put a genuine geopolitical premium into gold, along with renewed Strait of Hormuz risk that threatened global oil flows.
Central-bank buying, at a scale not seen in decades. According to World Gold Council data reported via Kitco, central banks bought 1,136 tonnes in 2022 (a record), 1,051 tonnes in 2023, and 1,045 tonnes in 2024 — three consecutive years above 1,000 tonnes, versus a 2010-2021 average of just 473 tonnes. That's an enormous, sustained source of structural demand that individual investors don't usually see coming from the official sector.
De-dollarization. A slower-moving but real trend of central banks and sovereign funds diversifying reserves away from dollar-denominated assets, with gold as the natural alternative.
Why It's Cracking Now
The same three forces that pushed gold up have partly reversed, plus a new one has shown up:
A hawkish Fed. New Chair Kevin Warsh has pushed back against rate-cut expectations, and rising real yields — the return on inflation-protected bonds — directly compete with gold, which pays no yield of its own. When real yields rise, the opportunity cost of holding gold rises with them.
A stronger dollar. The DXY dollar index has pushed above 101, and gold, priced in dollars globally, mechanically gets more expensive for foreign buyers when the dollar strengthens — a headwind on demand.
Profit-taking. After more than doubling in about a year, a wave of investors simply took the win. That's not a bubble popping — it's normal behavior after an extreme run.
The buying pace itself slowed. This is the one I think is underappreciated: central-bank buying, per the World Gold Council's FY2025 Gold Demand Trends report, fell to roughly 863 tonnes in 2025 — still a large number historically, but a real break from the 1,000+ tonne streak of 2022-2024.
Correction Versus Broken Thesis
A price falling doesn't tell you whether the reasons behind the original rally were fake — it tells you the balance between buyers and sellers has shifted. Central banks buying 863 tonnes in 2025 is still a lot of gold; it's a deceleration from an extraordinary pace, not a stop. That's a meaningfully different situation than, say, a company whose earnings turned out to be fabricated.
Is This a Crash or a Correction? History's Answer
Gold has a well-documented history of brutal drawdowns, and it's worth putting 2026 in that context rather than treating it as unprecedented.
Gold's historical peak-to-trough drawdowns
Crash
Peak → Trough
Drawdown
Recovery Time
1980-2008
~$850 → multi-decade grind
~85% (nominal low)
~28 years to a new nominal high
2011-2015
~$1,921 → ~$1,050
~45%
Several years
2026 (so far)
~$5,589 → ~$4,000
~29%
Unresolved
The 1980 crash is the extreme case people invoke when they call gold a bad long-term holding — and it's a fair point taken on its own. Gold's real, inflation-adjusted peak from 1980 didn't get matched again until decades later, somewhere in the $3,200-3,600 range in today's dollars. That's a legitimately brutal lesson about buying gold at a euphoric top.
But the 2026 drawdown, at roughly 29%, is meaningfully shallower than either historical benchmark so far. That doesn't guarantee it stays shallow — Goldman Sachs analysts Lina Thomas and Daan Struyven cut their December target from $5,400 to $4,900 in a June 20 note, with a $4,400 downside case if the Fed actually hikes. But "shallower than history's worst gold crashes, so far" is a meaningfully different starting point than "the same magnitude as 1980."
The 2025 Numbers That Actually Matter
Here's a comparison I think gets lost in gold-specific coverage: how did gold's 2025 stack up against other assets, not just against itself?
The Case Gold Held Up
Gold returned roughly +60% (spot) in 2025 — dramatically outperforming the S&P 500's ~19% total return
Bitcoin, often pitched as 'digital gold,' actually fell roughly -5% in 2025 — the worst showing among major assets, with the S&P Bitcoin Index down -46% over the trailing year as of July 16, 2026
Central-bank demand, while decelerating, remained historically elevated at ~863 tonnes in 2025
The World Gold Council estimates fair value for gold around $4,100 — close to where it's currently trading
The Case for Caution
Goldman Sachs cut its Dec 2026 target from $5,400 to $4,900, with a $4,400 bear case if the Fed hikes
A ~29% drawdown from the peak is a real loss for anyone who bought in Q4 2025 or January 2026
Rising real yields and a strong dollar are structural headwinds that don't reverse quickly
The 2025 buying-pace deceleration (863t vs. 1,000+t in prior years) suggests the central-bank bid, while still large, is not accelerating further
Taken together, I don't read this as "gold's story broke." I read it as "gold had one of its best years ever in 2025, got ahead of itself, and is now repricing against a genuinely hawkish rate environment." Those are compatible facts.
The Tax Trap Nobody Mentions
If you're thinking about adding gold, this is the detail I most often see skipped in casual coverage, and it can materially change your after-tax return.
Physical gold and grantor-trust ETFs — GLD, IAU, SGOL — are taxed by the IRS as collectibles, at a maximum long-term capital gains rate of 28%. That's meaningfully worse than the standard 15% or 20% long-term rate most equity investors are used to. High earners could also face the additional 3.8% Net Investment Income Tax on top of that.
Gold mining stocks and mining funds, like GDX, are not collectibles — they're taxed at ordinary long-term capital gains rates (15-20%), the same as any other stock.
Check Your Ticker Before You Assume Your Tax Rate
Not every "gold ETF" is structured the same way. GLD, IAU, and GLDM are grantor trusts holding physical bullion — collectibles tax treatment applies. A gold mining equity fund like GDX holds shares of mining companies — ordinary capital gains treatment applies. The name "gold fund" doesn't tell you which bucket you're in; the structure does.
Expense ratios also vary more than people expect: GLD charges around 0.40%, IAU around 0.25%, and GLDM around 0.10% — over a long holding period, that fee gap compounds into a meaningful difference for what's ultimately the same underlying exposure to bullion.
How Much Gold Should You Actually Own?
There's no single right answer, but there's a reasonably tight consensus range.
Range of gold allocation guidance
Source
Suggested allocation
Reasoning
World Gold Council
~5%
Historically improves portfolio Sharpe ratio
Common financial-planning guidance
5-10%
Diversification without over-concentration
Ray Dalio (Fortune, Oct 2025)
10-15%
Hedge against currency debasement and geopolitical risk
CPM Group
~20%
More aggressive commodity-hedging stance
My honest take: 5-10% is the sensible range for most people, sized as a genuine diversifier rather than a speculative bet on the next leg of the price. If you already hold gold and you're rattled by this drawdown, that's usually a sign your position was sized for the rally, not for the role gold is actually supposed to play in a portfolio — insurance, not a growth engine.
Dollar-Cost Average Rather Than Chase or Panic-Sell
Given how sharp both the rally and the correction have been, lump-sum decisions right now are essentially bets on short-term direction. Building or trimming a gold position gradually — the same logic that applies to any volatile asset — reduces the odds you're buying the next local top or selling the next local bottom.
Model Your Own Allocation
Rather than debate the "right" percentage in the abstract, it helps to see what different gold weightings actually do to a portfolio's expected return and volatility using long-run historical relationships.
Interactive · long-run historical blend
What adding gold does to a stock portfolio
Gold allocation10%
Remaining 90% held in a diversified stock portfolio.
Expected return
0.0%
Volatility
0.0%
Sharpe ratio
0.42
vs. 0.40 at 0% gold
Illustrative only, using long-run approximate figures (gold ~7.5% return / ~16% volatility; diversified stocks ~10% / ~15%; ~0.05 historical correlation; 4% risk-free rate). Actual future returns, volatility, and correlation will differ — this models the historical diversification effect, not a forecast for either asset.
Move the slider and watch how a small gold allocation changes expected return, volatility, and the portfolio's Sharpe ratio relative to a 100% stock baseline. It's a simplified model using long-run averages, not a prediction of what gold or stocks do from here — but it illustrates why "some gold" has historically behaved differently than "no gold" or "a lot of gold."
If gold's volatility has you thinking harder about your overall portfolio construction, my index fund investing guide and emerging markets piece cover the diversification side of that conversation, and the tools page has more calculators in the same spirit as the one above.
Frequently Asked Questions
Gold didn't crash so much as correct hard after an extreme run. It hit a record near $5,589/oz on January 28, 2026, driven by the Iran war, central-bank buying, and de-dollarization fears. Since then, a hawkish Fed under Chair Kevin Warsh, rising real yields, a stronger dollar, and simple profit-taking after a huge rally have pulled it down to roughly $3,965–4,017/oz by mid-July — a correction of nearly 29%, but still well above where gold traded before this cycle's rally began.
The Bottom Line
This is a violent, rate-driven correction inside a structural gold story that's still mostly intact — not a bubble that's popped and gone to zero, and not a "buy the dip blindly" signal either. If you want exposure, keep it to a sensible 5-10% of your portfolio, be deliberate about which vehicle you use given the 28% collectibles tax trap, and build or trim the position gradually rather than making a lump-sum bet on a move this volatile.
This is educational content, not financial advice. I'm a researcher, not your advisor, and I don't know your full financial situation. Gold and precious metals prices are volatile and can decline sharply; tax rules discussed here are general and can vary by jurisdiction and individual circumstances. Consider talking to a licensed financial or tax professional before making investment decisions. See the full disclaimer.

 Sujit Karki|||8 min read