Higher-for-Longer, One Year On: What Actually Belongs in Your Fixed-Income Sleeve Now
With the 10-year Treasury near 4.5% and real yields above 2%, here's how T-bills, TIPS, I bonds, and bond funds actually differ — and what to hold now.
A T-bill held to maturity returns a known amount. A bond fund's price fluctuates with rates and has no maturity date, so it can lose value if yields rise — but it also captures higher yields as it rolls. They serve different purposes.
Get new posts in your inbox
No spam, unsubscribe anytime.
About the Author
Sujit KarkiFinance Researcher & Market Analyst
Independent finance researcher and market analyst with expertise in macroeconomics, equity markets, and personal finance. I help regular investors make better-informed decisions through rigorous, data-driven analysis.
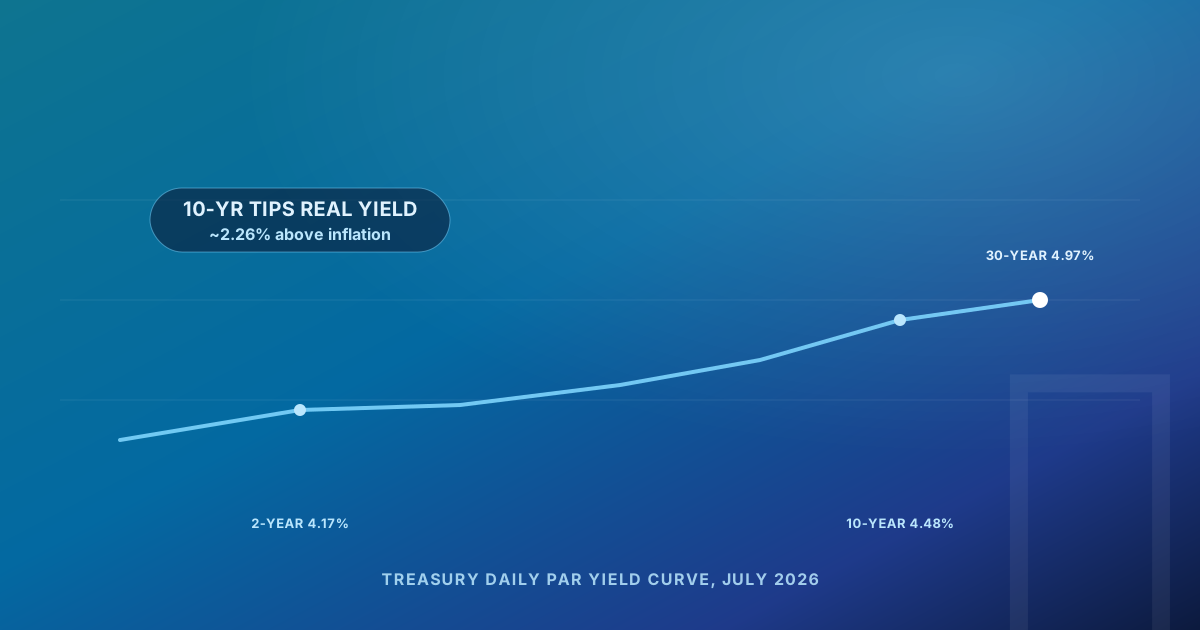
As of mid-to-late July 2026, the 10-year Treasury yielded about 4.48%, the 2-year about 4.17%, and the 30-year about 4.97% — income is back in fixed income.
The 10-year TIPS real yield was around 2.26%, meaning you can lock in roughly 2% above inflation — historically generous.
The Series I savings bond composite rate is 4.26% through October 2026, combining a 0.90% fixed rate with a 3.34% annualized inflation component.
T-bills, bond funds, TIPS, and I bonds quote yields that measure different things — nominal, real, and after-inflation — so comparing the headline numbers directly is a mistake.
Three events line up over the next two weeks: Treasury's financing estimates (Aug 3), the quarterly refunding statement (Aug 5), and the July jobs report (Aug 7).
For most of the 2010s, the fixed-income part of a portfolio was an afterthought — you held bonds for ballast, not income, because they barely paid. That era is over. With the 10-year Treasury sitting near 4.5% and real (after-inflation) yields above 2%, the "safe" sleeve of your portfolio is doing real work again. But it also means the choices inside that sleeve matter more, and the differences between them are wider than most people realize.
The setup ahead of August
A quick snapshot of where yields sit, based on Treasury's most recent published par yield curve as of this writing:
2-year Treasury: ~4.17%
10-year Treasury: ~4.48%
30-year Treasury: ~4.97%
10-year TIPS real yield: ~2.26%
Two things frame the days ahead. First, on August 3 the Treasury releases its quarterly financing estimates, and on August 5 it publishes the full refunding statement and auction schedule — the market watches these closely because they set the supply of new debt, which pushes on longer-term yields. Second, on August 7 the July jobs report lands; after June came in soft at +57,000 payrolls, another weak print would revive the case for rate cuts and could pull yields down.
Warning
The yields above are the most recent I could confirm from Treasury's daily curve at the time of writing. Yields move daily — check Treasury's "Daily Treasury Par Yield Curve Rates" for the current print before acting, especially once this week's financing estimates and refunding statement land.
The fixed-income menu, decoded
Instrument
Recent yield
Rate risk
Best for
T-bills (≤1 yr)
~4.1–4.2%
Very low
Cash you'll need soon
Treasury notes (2–10 yr)
~4.2–4.5%
Moderate
Locking in today's yield
10-yr TIPS
~2.26% real
Moderate
Inflation protection
Series I bonds
4.26% composite
None (held)
Long-term inflation hedge, small amounts
Total-bond-market fund
varies
Moderate–high
Hands-off diversification
Why these yields aren't comparable
This is the part I wish more explainers were honest about. The headline numbers above are measuring genuinely different things:
A T-bill or Treasury note yield is a nominal yield — it includes expected inflation.
A TIPS real yield (2.26%) is what you earn above inflation; the inflation adjustment comes on top.
An I bond composite rate (4.26%) is a nominal rate too, but it's built from a 0.90% fixed component plus an inflation component (a 1.67% semiannual figure, ~3.34% annualized, set May 1, 2026) — and it resets every six months.
So you cannot say "the 10-year at 4.48% beats TIPS at 2.26%." They're not the same units. If inflation runs around 2.5%, a 2.26% real TIPS yield implies a nominal return near 4.8% — competitive with the nominal 10-year, with inflation protection built in. Compare like with like.
For reference, June 2026 CPI came in at 3.5% year-over-year headline and 2.6% core, so inflation is cooling but not gone — which is precisely why the real-versus-nominal distinction matters right now.
What the yield curve is telling you
With the 2-year around 4.17% and the 10-year around 4.48%, the curve has a modest positive slope — you're paid a little extra to lend longer. That's a normalization from the deep inversion of a couple of years ago. It doesn't scream recession, but the flatness means extending maturity for a few extra basis points isn't obviously worth the added price risk unless you specifically want to lock in today's yield for a decade.
Pro Tip
If your goal is simply "don't lose money and earn a real return," short T-bills and TIPS do most of the job today without forcing a big bet on the direction of rates.
Interactive · compare after-tax yield
Treasury vs. bank account: what do you actually keep?
Treasury yield4.48%
Bank / CD yield4.00%
Federal bracket24%
State tax rate5.0%
Principal$10,000
After tax, the Treasury yields 3.40% versus 2.84% for the bank account — on $10,000, that's about $56.48 more per year with the Treasury.
After-tax Treasury yield
0.00%
After-tax bank yield
0.00%
Annual after-tax difference
$0
Estimate only — not financial or tax advice.
Treasury vs. bank yield — data table
Treasury yield
4.48%
Bank yield
4.00%
After-tax Treasury
3.40%
After-tax bank
2.84%
Annual $ difference
$56.48
Compare your options
The calculator above compares the after-tax yield of a Treasury (state-tax-exempt) against a bank savings account or CD (fully taxable) at your bracket and state rate — because the stated rate isn't what you keep. It's an estimate, not investment advice.
Match maturity to when you need the money. Cash for the next year or two belongs in T-bills or a money-market fund, not a long bond that can drop if rates rise.
Lock in some real yield with TIPS while it's above 2%. That's a historically good level for inflation-protected income.
Use I bonds for a small, long-horizon inflation hedge — but respect the $10,000 annual limit and the one-year lockup.
Prefer Treasuries over bank CDs in taxable accounts when the after-tax math (Treasuries are exempt from state tax) favors them — run your own numbers.
Don't try to trade the refunding or the jobs report. Use them as information about the regime, not as day-trade triggers.
Rebalance, don't forecast. If bonds are now doing their job again, let them — resist the urge to reach for yield in riskier credit.
Frequently Asked Questions
A T-bill held to maturity returns a known amount. A bond fund's price fluctuates with rates and has no maturity date, so it can lose value if yields rise — but it also captures higher yields as it rolls. They serve different purposes.
This is educational content, not financial advice. I'm a researcher, not your advisor, and yields quoted here change daily. Verify current rates directly with Treasury before making decisions. See the full disclaimer.

 Sujit Karki||5 min read