Bitcoin at $65K: Down 50% From Its Peak — Falling Knife or the Buy of the Cycle?
Bitcoin crashed ~50% from its $126K peak and bounced off $60K this week. Here's why it fell, what the halving cycle says about a late-2026 bottom, and how to think about buying without torching your savings.
Mostly macro, not crypto. A US–Iran conflict pushed inflation back up, the Fed under Kevin Warsh turned hawkish and stopped signaling rate cuts, the dollar firmed, and money rotated into AI stocks. Spot Bitcoin ETFs saw record outflows in June, and Strategy's first sale in four years spooked sentiment. Unlike 2022, nothing inside crypto actually broke.
Get new posts in your inbox
No spam, unsubscribe anytime.
About the Author
Sujit KarkiFinance Researcher & Market Analyst
Independent finance researcher and market analyst with expertise in macroeconomics, equity markets, and personal finance. I help regular investors make better-informed decisions through rigorous, data-driven analysis.
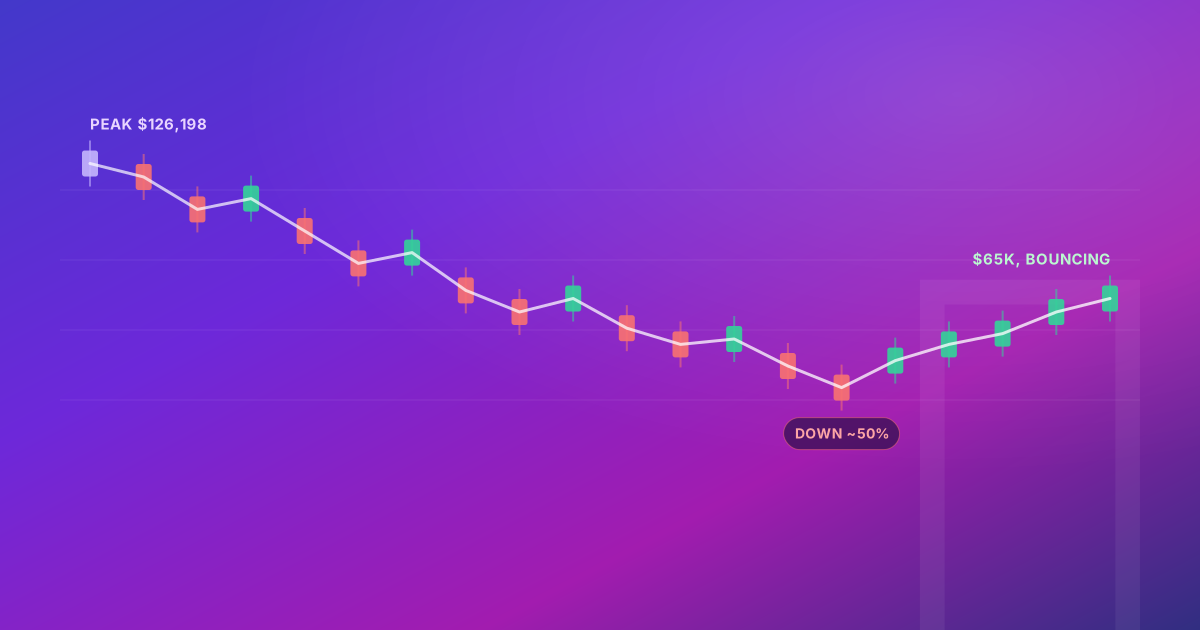
Bitcoin is down roughly 50% from its October 2025 peak of $126,198, but bounced off $60K and opened at $65,000 on July 15, 2026
The crash was driven by macro forces — a hawkish Fed, resurgent inflation, and rotation into AI stocks — not a crypto-native solvency crisis like 2022
A 50% drawdown is roughly the middle of a typical Bitcoin bear market, not the end of one — past bears have run 75-84%
On-chain models cluster a possible cycle low in the September-November 2026 window, though these are scenarios, not guarantees
Dollar-cost averaging into drawdowns like this has historically beaten trying to time the exact bottom — but only with money you can afford to lose
So Bitcoin dipped under $60,000 a couple weeks back, and my inbox turned into a support group.
I get it. If you bought anywhere near the top last October — when BTC printed $126,198 and every timeline was screaming "supercycle" — you're staring at a position that's basically been cut in half. That's a gut punch. And the questions flooding in all rhyme: why is Bitcoin crashing, is Bitcoin dead, should I buy this dip or run for the hills?
Here's where we actually are as I write this. Bitcoin bounced off that $60K floor and opened around $65,000 on July 15 — up 4.4% on the day — after a softer-than-expected inflation report. Ethereum jumped even harder, up 6.6% to about $1,889. So the falling-knife phase paused. But let me be honest up front: a two-day bounce is not a bottom, and anyone who tells you they know it is doesn't.
Peak (Oct 6, 2025)$0All-time high
Current (Jul 15, 2026)$0Up 4.4% on the day
Drawdown0%Peak to current
Let me walk you through what happened, what the halving cycle is whispering, and — the part you actually came for — how to think about buying without doing something you'll regret.
Quick housekeeping: Back on June 3 I published a short macro-analysis piece on Bitcoin. A lot has changed since then — the ETF picture flipped, Strategy sold coins, and we've had a proper washout — so I've folded that piece into this one rather than leave a stale take standing. Treat this post as the update.
Why Bitcoin Actually Crashed
The weird thing about this crash? Nothing inside crypto broke.
Think back to the ugly ones. 2018 was a retail mania blowing off — Bitcoin fell 84%, from $19,783 to $3,122, over about fourteen months. 2022 was fraud: Terra imploded, then FTX took the whole thing down — a 77.5% wipeout, from $68,789 to $15,476. Both times, the plumbing itself cracked and trust took years to rebuild.
This time, no major exchange failed. No big stablecoin lost its peg. The damage came from outside crypto, and it's honestly more boring than a scandal. Three things:
1. Inflation came back, and the Fed got mean. A US–Iran conflict pushed oil higher earlier this year, energy prices ripped, and inflation reaccelerated — May CPI hit 4.2%, the hottest since 2023. New Fed Chair Kevin Warsh, confirmed in May, held rates at 3.50–3.75% and scrapped the old habit of hinting at the next move. Suddenly the market wasn't pricing rate cuts — it was pricing possible hikes. Higher rates are kryptonite for a non-yielding asset like Bitcoin.
2. The ETF money went into reverse. The spot Bitcoin ETFs did most of the buying on the way up. In 2026 they flipped hard — June was their worst month on record, roughly $4.5 billion out the door, and year-to-date flows went negative for the first time since launch. BlackRock's IBIT, the biggest fund, became the main exit lane. Flows did turn positive again on July 14 — the first green day after a 30-day, ~$4.6 billion outflow streak.
3. The money that left crypto had somewhere better to go. AI stocks. When SpaceX had a monster ~$75 billion market debut in June, risk-seeking capital had a shiny new home. Even gold, which spiked to a record $5,589 in January, got yanked around — it's since fallen below $4,000. Money rotated, and crypto wasn't the party anymore.
Then came the symbolic gut-check: Strategy — Michael Saylor's company, the loudest "never sell" voice in the game — sold 32 Bitcoin in late May. Tiny amount, about $2.5 million against a stash of 843,706 coins. Economically it's a rounding error. But the symbolism spooked people, and the market treated it like a fire alarm.
Stack it all up and you get a roughly 50% drawdown. Which sounds apocalyptic — until you look at the history. And it wasn't just Bitcoin — altcoins took it much harder:
The Part Nobody Wants to Hear: This Is Normal
I know, I know. But it's true, and it matters.
Bitcoin has fallen 50%+ from a high multiple times in the last decade — and it has never not recovered to a new high eventually. The 2022 crash cut it more than three-quarters; over the following years it not only recovered but printed fresh records. A 50% drawdown is roughly the middle of an ordinary Bitcoin bear market, not the end of the world.
Here's a comparison I keep coming back to:
Bitcoin drawdowns by cycle
Cycle
Peak-to-trough drawdown
Trigger
2018
−84% ($19,783 → $3,122)
Retail speculative blow-off
2021–22
−77.5% ($68,789 → $15,476)
Terra + FTX fraud (solvency crisis)
2026 (so far)
~−50%
Macro de-risking (liquidity, not solvency)
That last column is the whole point. A crash caused by fear and tight money tends to reprice faster than a crash caused by fraud, because the assets are still there — you just have to wait for the macro to turn. The leverage that fueled the fall has largely been flushed (open interest dropped to about $46.5 billion), which means another leg down would need a fresh shock, not just more forced selling.
The Halving Cycle — And Why I Don't Worship It
You've probably heard of the four-year cycle. Quick version: Bitcoin's supply issuance gets cut in half roughly every four years. Historically, price peaks about 18 months after each halving, then bleeds into a bottom before the next run.
The April 2024 halving fits this eerily well — a peak in October 2025 lands right in that window. And if you run the pattern forward, a lot of the on-chain models cluster a cycle low around September to November 2026, with price zones anywhere from the low $50Ks down toward the $30Ks depending on who's modeling.
Cycle Models Are a Lens, Not a Crystal Ball
Every cycle, the returns have compressed — each peak delivers a smaller percentage gain than the last as Bitcoin matures. This time there's a genuinely new variable: ETFs and institutions that didn't exist in 2018 or 2022. That could mean shallower drawdowns — or it could mean the old timing signals are less reliable than the cycle crowd insists. Treat any specific date or price target, mine included, with a healthy pile of skepticism.
What the On-Chain Data Is Actually Saying
A few gauges I watch, and what they're flashing right now:
Fear & Greed Index: deep in "Extreme Fear," reading around 25. It hit an all-time low of 12 back in February. Historically, extreme fear is where opportunities live — but "extreme fear" can persist for weeks while price keeps grinding. It's a mood ring, not a stopwatch.
MVRV ratio ~1.19 / Z-Score ~0.37: in plain English, the average holder is barely above break-even, and Bitcoin sits close to its "realized price" (roughly $52,500 — the average price everyone actually paid). Readings this low have historically marked value zones, not tops.
Realized profit/loss ratio hit −0.35 — its lowest since December 2022, when BTC was under $16,000 right after FTX. That same reading marked cycle bottoms in 2015, 2019, and 2022. Not a guarantee. A pattern.
Miners are stressed. Hashprice hit a record low in June and Bitcoin has traded near or below the cost to mine it. When miners capitulate, it's painful — but it has also historically clustered near bottoms.
None of these is a buy button. Together they say: this looks a lot more like a middle-innings washout than the start of a multi-year winter.
The Bull Case vs the Bear Case
Let me lay both out straight, because anyone selling you certainty is selling you something.
Bull Case
Drawdown is shallower than past bears, and it's macro-driven, so it can heal faster
Leverage is flushed; whales quietly scooped 270,000+ BTC around the lows
Standard Chartered's Geoff Kendrick kept his $100K year-end target and called the dip a buying opportunity
Bitwise's Matt Hougan said he expects a new bull market in the fall
ETF flows just turned positive again on July 14 after a brutal streak — a first sign institutions are stepping back in
Bear Case
The Fed still leans hawkish, with a real chance of a rate hike in September
Citi cut its 12-month target to $82,000 from $112,000 and set a bear case near $53,000
If this becomes a ~75% drawdown like past cycles, that implies something close to $30K
"This cycle is different" cuts both ways — maybe ETFs also mean the old halving-bottom timing doesn't hold
Altcoins fell much harder than BTC, a sign risk appetite hasn't fully returned
I sit closer to the constructive side — the macro-not-fraud distinction is a big deal to me — but I'm not betting the house on it, and neither should you.
OK, So Should You Buy?
This is where I get to be blunt, because it's the whole reason you're reading.
Nobody can call the bottom. Not me, not the analyst with the $100K target, not the guy on YouTube with the laser eyes. So stop trying. The question isn't "is $65K the bottom?" It's "how do I build a position that survives being wrong about the bottom?"
The historical math is genuinely encouraging on one point: buying into 50% Bitcoin drawdowns via dollar-cost averaging — fixed amounts on a schedule — has beaten panic-selling essentially every time over multi-year holds. A monthly DCA held three years or longer has been profitable 100% of the time historically, even for people who started at cycle tops. And in mid-range drawdowns like this one, DCA has actually outperformed dumping a lump sum in, because you keep buying as it falls instead of guessing the low.
But — and this is the part people skip — that only works with three guardrails:
Only money you can genuinely afford to lose. Bitcoin has had four 70%+ drawdowns. Size every position assuming another one is possible tomorrow. If a 70% haircut on your crypto would wreck your life, your position is too big. Full stop.
Position sizing first, conviction second. For most people that's 1–5% of a diversified portfolio; aggressive types maybe up to 10%. A 10% allocation in a $10,000 portfolio is $1,000 at risk. Same 10% in a $500,000 retirement account is $50,000. Do that math before you get excited.
Never lump-sum your life savings into a falling market. Spread it out. If you've got money to deploy, split it into chunks over the next 12–18 months. You'll never nail the exact bottom, and that's fine — you're not supposed to.
Never Invest More Than You Can Afford to Lose
Bitcoin has experienced four drawdowns greater than 70% in its history. Any allocation must be sized under the assumption that a 70–80% drawdown is possible at any time.
One more, since it's tax season year-round for crypto people: if you're sitting on losses, crypto isn't subject to the wash-sale rule in 2026 — the IRS treats it as property, not a security. You can sell at a loss to harvest it against gains — up to $3,000 against ordinary income, rest carries forward — and rebuy the same coin immediately. Just know two things: spot Bitcoin ETFs like IBIT are securities, so the 30-day wash-sale rule fully applies to them, and Congress keeps threatening to close the crypto loophole, possibly by 2027.
Run Your Own Numbers
I built a calculator for exactly this moment. Instead of me telling you DCA works, go see what it would've done through the actual 2025–26 crash — and stress-test what happens with different starting points and monthly amounts.
Interactive · run your own numbers
DCA vs. lump sum vs. waiting on the sidelines
When did you start buying?
Starting at the October 2025 peak ($126,198) through today ($64,975) — 10 months.
Monthly amount$200
On $0 invested, dollar-cost averaging would be worth about $1,833 today (-8%).
Dollar-cost averaged in monthly · avg cost $70,910$1,833
All in on day one, at Oct 2025 price$1,030
Waited in cash, bought it all today$2,000
Illustrative only, using approximate monthly BTC reference prices from Oct 2025 to Jul 15, 2026 ($64,975). Past performance over one specific stretch of one specific asset says nothing about what happens next — this tool is for building intuition about DCA mechanics, not a return forecast. Ignores fees and taxes.
Pick when you would have started buying, set a monthly amount, and it'll show you dollar-cost averaging vs. a lump sum vs. waiting in cash and buying today — average cost, current value, and the gain or loss you'd actually be sitting on. The "wait for a better price" scenario is usually the most humbling one.
Bitcoin isn't the only asset relitigating its "safe haven" reputation in 2026 — gold has had its own violent round trip; see gold's crash from $5,600 to $4,000 for the other side of that argument.
Frequently Asked Questions
Mostly macro, not crypto. A US–Iran conflict pushed inflation back up, the Fed under Kevin Warsh turned hawkish and stopped signaling rate cuts, the dollar firmed, and money rotated into AI stocks. Spot Bitcoin ETFs saw record outflows in June, and Strategy's first sale in four years spooked sentiment. Unlike 2022, nothing inside crypto actually broke.
The Bottom Line
This crash is scary but ordinary — a macro washout, not a broken market. The halving cycle and the on-chain data both lean toward "middle of a bear, not the death of one," with a possible low later in 2026. If you want exposure, dollar-cost average with money you can lose, keep the position small, and never dump your savings into a falling knife hoping to catch the exact bottom. You won't. Neither will I. That's exactly why we average in.
This is educational content, not financial advice. I'm a researcher, not your advisor, and I don't know your situation. Cryptocurrency is extremely high-risk — Bitcoin has repeatedly lost 70–80% of its value and could do so again. Never invest money you can't afford to lose entirely, and consider talking to a licensed financial professional before making decisions. See the full disclaimer.

 Sujit Karki||10 min read